|
<< Click to Display Table of Contents >> Navigation: »No topics above this level« Welcome / Dashboard |

|
|
<< Click to Display Table of Contents >> Navigation: »No topics above this level« Welcome / Dashboard |

|
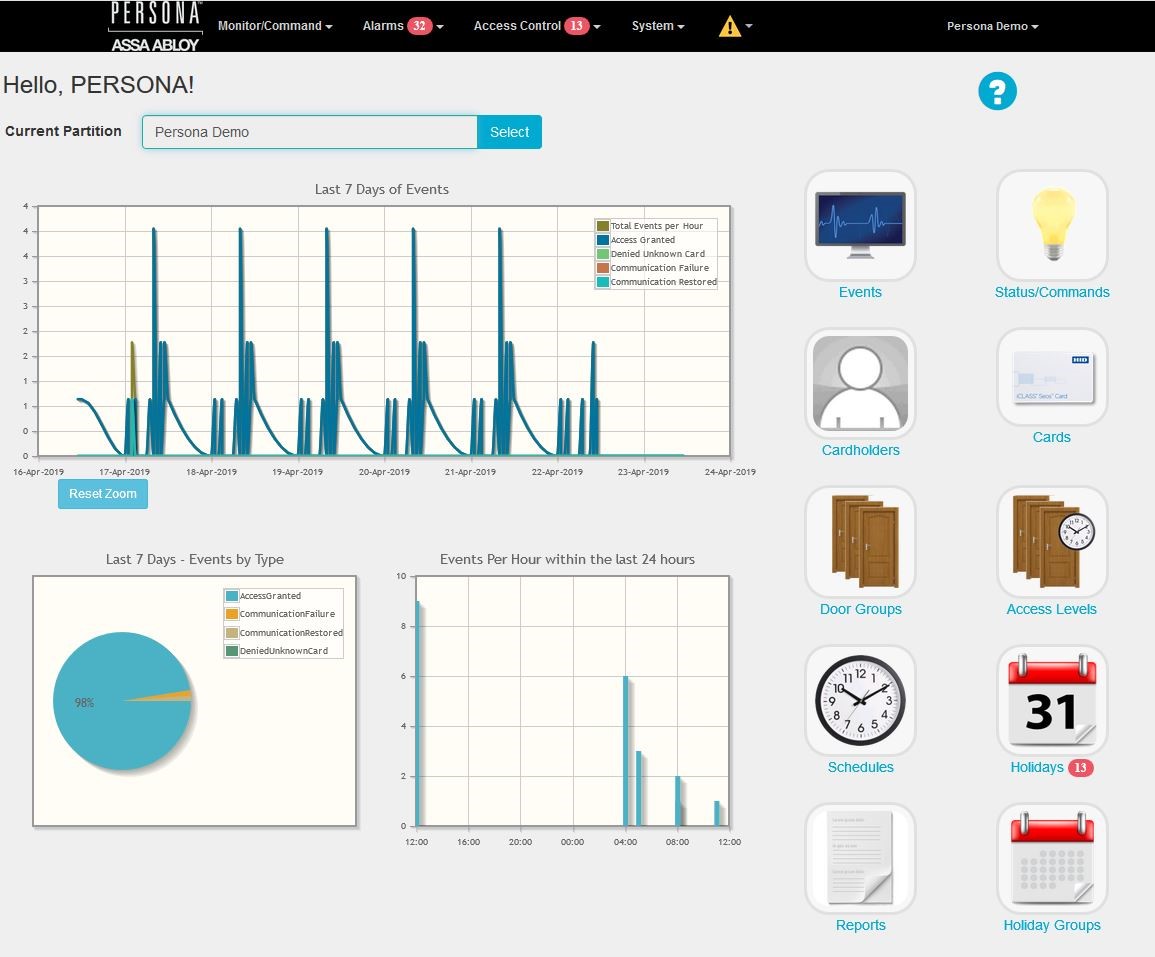
After logging to the web-client you will be brought to the welcome page/dashboard. This page will give you an overview of events that have been coming into your system, the full menu bar along the top of the screen, and icons for the most commonly used pages within the system. This will also be the page where any errors or warnings that the system needs to display will be presented. If you click on the logo at the top left of the web-client, you will always be taken back to the Welcome Page.

The charts and graphs presented on this page will show the event count for a preset list of events type along with the total event count in your system. This can be used as a visual overview to see the health of your system and be made aware of any abnormal counts of communication failure related events occurring over the past few days.
The top menu bar will display every page available in the system that the user logged in has permission to view. Administrators can determine by a user’s role which pages they have access to and what they have permission to do on those pages. If you are unable to see a page mentioned within this guide it might be unavailable to you and you will need to consult with your system administrator.
To the right of the menu bar, you will see the name of the partition you are currently logged into listed and this is where you will be able to logout, change your password or change partitions if you have access to multiple partitions.
